
During Aug 24–30, 2026, US spot BTC and ETH ETFs took in a combined $1.7402B, but the mix diverged sharply. BTC net inflows fell 51.8% to $924.5M; ETH net inflows rose 17.8% to $815.7M, with all five sessions positive. BTC, ETH and HYPE also fell on lower volume while Fear & Greed rose to 70.4. The evidence fits post-rally consolidation with marginal demand spreading toward ETH rather than broad retreat, although persistently positive BTC funding leaves the range vulnerable.
Measurement window: Aug 24, 2026 at 00:00 UTC through Aug 31 at 00:00 UTC, excluding the end timestamp. The comparison week is Aug 17–23. ETFs follow five US trading sessions; volume is base-asset volume from Hyperliquid daily candles; funding is the simple sum of 168 hourly rates.
The week’s central change was this: ETF capital did not broadly leave, but continued to spread toward ETH as incremental BTC buying slowed sharply. US spot BTC and ETH ETFs still took in $1.7402 billion. BTC inflows fell 51.8% week on week, while ETH inflows rose 17.8% and stayed positive for all five sessions.
The short view: this looks more like post-rally, lower-volume consolidation with diverging marginal demand than broad risk-off. Elevated sentiment and persistently positive BTC funding still leave the range vulnerable.
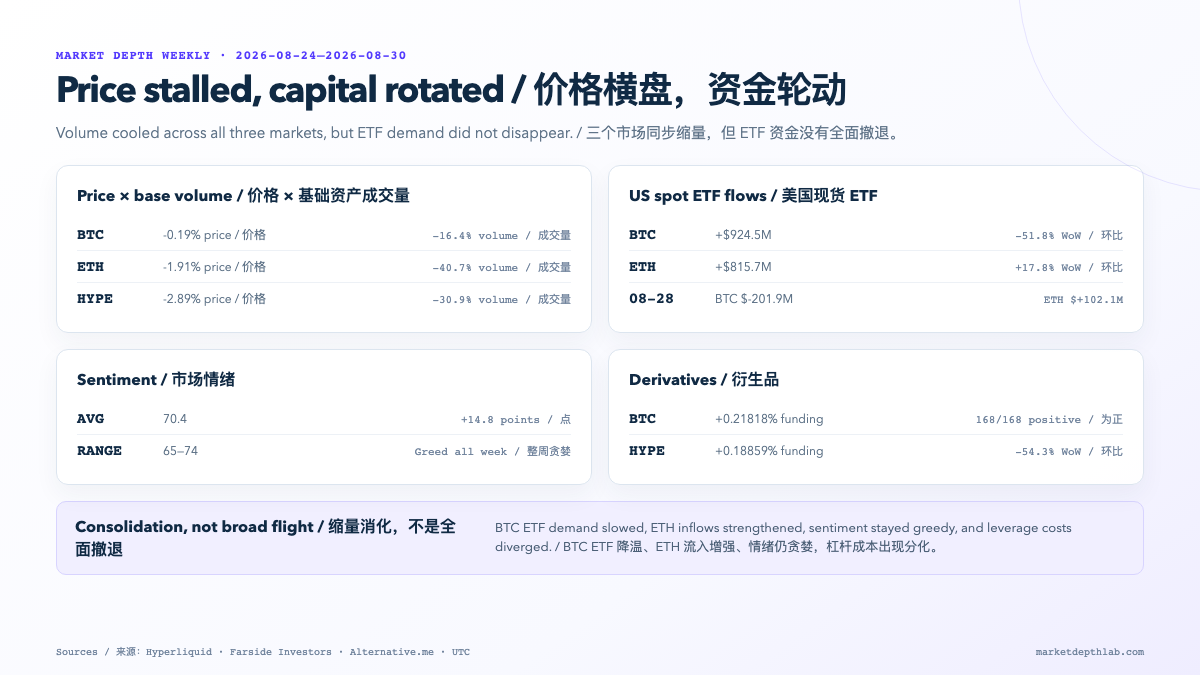 Figure 1: Four-dimensional market dashboard. Price, volume and funding use Hyperliquid; ETF flows use Farside Investors; sentiment uses Alternative.me.
Why does this look like flow divergence rather than broad retreat?
| US spot ETF | Prior-week net flow | Report-week net flow | Weekly change | Positive days | Aug 28 |
|---|---|---|---|---|---|
| BTC | +$1,917.8M | +$924.5M | -51.8% | 4 / 5 | -$201.9M |
| ETH | +$692.6M | +$815.7M | +17.8% | 5 / 5 | +$102.1M |
| Combined | +$2,610.4M | +$1,740.2M | -33.3% | — | -$99.8M |
The data do not show a broad ETF retreat. The report week still delivered $1.74 billion of net inflows, although the combined total fell one-third. The internal change mattered more: BTC inflows fell by nearly $1 billion and turned negative Friday, while ETH posted five positive sessions and added $123.1 million more than the prior week. The daily BTC and ETH tables point to marginal demand spreading toward ETH.
This is not a wholesale switch from BTC into ETH. BTC still had the larger absolute weekly inflow, and the combined total remained positive. The more precise conclusion is: incremental BTC buying slowed sharply while institutional ETH demand strengthened, making flow divergence a better description than withdrawal.
Why does price and volume look more like consolidation than panic?
| Market | Weekly return | Weekly high | Weekly low | Base-volume change | Approx. notional change |
|---|---|---|---|---|---|
| BTC | -0.19% | $81,483 | $76,693 | -16.4% | -8.2% |
| ETH | -1.91% | $2,566.4 | $2,388.0 | -40.7% | -35.2% |
| HYPE | -2.89% | $86.727 | $76.594 | -30.9% | -21.2% |
BTC, ETH and HYPE all closed lower, while base-asset volume declined 16.4%, 40.7% and 30.9%. Prices fell modestly as activity fell much faster. BTC was closest to flat, while ETH and HYPE cooled more sharply. That looks more like participation fading after the prior week’s sharp advance than high-volume panic selling.
Approximate notional uses each day’s OHLC average multiplied by base-asset volume. It is intended for week-on-week direction, not as exchange-reported tick-level turnover. The conclusion survives this second measure: activity declined across all three assets.
How did Hyperliquid funding rates change this week?
| Market | Current 168-hour funding | Prior week | Change |
|---|---|---|---|
| BTC | +0.21818% | +0.15327% | +0.06491 pp |
| ETH | +0.18812% | +0.18486% | +0.00326 pp |
| HYPE | +0.18859% | +0.41222% | -0.22363 pp |
All three weekly sums remained positive, so longs paid shorts on net. The change was not uniform: BTC’s cumulative cost increased and every one of its 168 observations was positive; ETH was almost unchanged; HYPE’s cumulative cost fell 54.25%, although it remained positive overall.
Price did not confirm a clean bullish signal from that positioning. BTC was nearly flat while long-side cost increased, ETH fell 1.91% with funding little changed, and HYPE fell 2.89% even as its exceptional funding premium unwound. Our reading is therefore continued long-side demand without matching price momentum, not a forecast that positive funding must lift prices.
This interpretation should be rejected if price and participation realign next week—for example, if BTC or ETH breaks the report-week high on rising volume while funding stops increasing, or if falling prices are accompanied by expanding volume and a wider long-side funding premium. Either outcome would replace the current low-volume, fragile-consolidation reading with stronger trend evidence.
Why do sentiment and leverage leave the range vulnerable?
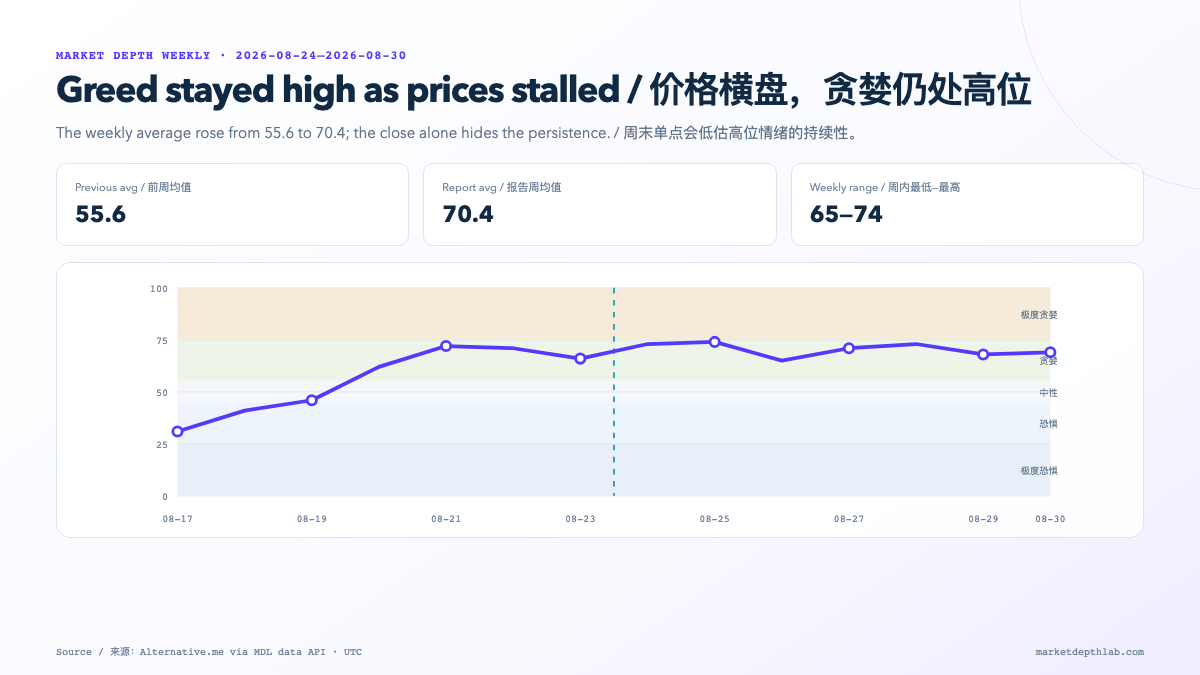 Figure 2: Daily Fear & Greed across the comparison and report weeks. The report-week average was 70.4 and all seven readings stayed between 65 and 74.
Fear & Greed never returned to neutral and its weekly average rose from 55.6 to 70.4, indicating that investors did not interpret lower activity as a new bearish trend. As the funding table above shows, BTC longs paid throughout the week while HYPE’s previously exceptional holding cost fell sharply.
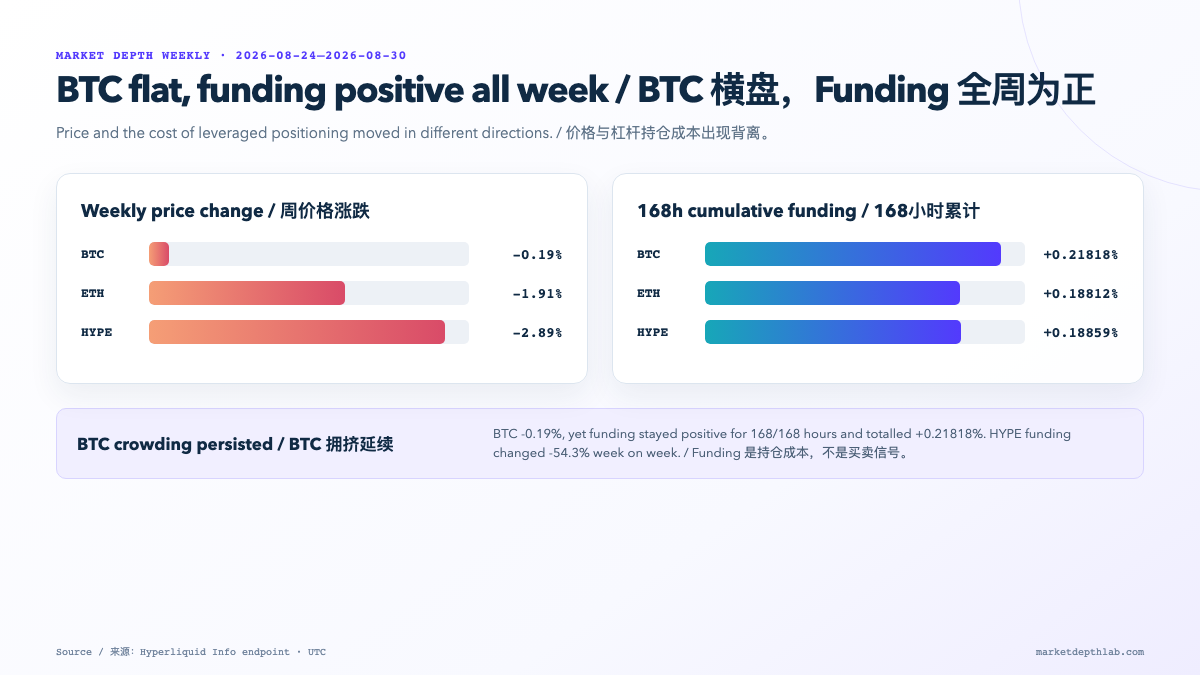 Figure 3: Weekly returns versus 168-hour cumulative funding. Funding is a holding cost, not a directional signal.
Funding is risk evidence here, not the article’s organising thesis. BTC stalled while longs kept paying; HYPE’s exceptional cost faded rapidly. Leverage crowding did not expand uniformly, but persistently positive BTC funding means the range may break lower more easily if ETF and spot absorption continue to weaken.
How do we explain positive ETF flows failing to push BTC higher?
Putting price-volume, ETFs, sentiment and funding together produces three constraints on the interpretation:
- ETFs were still absorbing supply, but at a clearly slower marginal pace. Combined BTC and ETH net inflows were $1.7402 billion, down 33.3% week on week; BTC inflows fell 51.8% and the final session turned negative.
- Price did not confirm a continuing breakout. BTC fell 0.19% as base-asset volume declined 16.4%, suggesting new demand was enough to avoid panic selling but not enough to push price above the $81,483 weekly high.
- Risk appetite did not retreat with momentum. The weekly Fear & Greed average rose to 70.4 and BTC funding stayed positive for all 168 hours. The market was not bearish, but longs paid continuously without producing fresh price momentum.
Our synthesis is that new capital continued to absorb supply, but with less force than the prior week, leaving the market to digest existing sell pressure. The evidence shows that ETF demand had not become broad retreat, yet was not strong enough to confirm another breakout. The available data cannot identify which holder group supplied the selling. ETF creations and redemptions do not all represent new directional demand, while positive funding can include hedges and basis trades, so the conclusion is limited to the market divergence the data can verify.
Which signals should validate or reject the view next week?
- Broad ETF retreat: If both the BTC and ETH daily tables turn negative for the week while volume expands into falling prices, “lower-volume consolidation” should be replaced with capital flight.
- ETH demand fails: If ETH ETF inflows fall below $692.6 million and price breaks $2,388, the demand-spreading interpretation would fail.
- BTC confirms the trend: If the BTC market dashboard shows a break above $81,483 with positive week-on-week volume and funding stops rising, that would look more like healthy spot-led continuation than fragile consolidation.
- Sentiment resets: If the Fear & Greed dashboard falls below 55 while BTC holds above $76,693, elevated-sentiment risk would have eased without necessarily turning the trend bearish.
These are conditions for reviewing the thesis, not automated trading triggers. The next review and historical method will remain on the Market Depth Weekly hub.
What are the data boundaries?
ETF flows use five complete US sessions, Hyperliquid price and volume use seven daily candles, and funding uses 168 hourly observations. If any series is incomplete, its weekly conclusion should be withheld. Hyperliquid volume and funding cannot be generalized to every exchange, and one ETF outflow day or sentiment reading cannot replace a complete-week trend.
MDL does not yet maintain its own complete historical open-interest, options-flow or account-level positioning series, so those dimensions are not used as core evidence in this issue. This is a multi-dimensional market record, not personalized investment advice.