
Prices have bounced, but a sustained recovery remains unconfirmed. US spot ETF net withdrawals slowed without turning into net inflows, while ETH and HYPE remained weaker than BTC. Watch price recovery, persistence in ETF flows and the performance of the asset you actually hold.
Bitcoin slipped below $80,000 and then recovered. Buying now could mean chasing another short-lived bounce; waiting could mean missing a recovery. What evidence helps tell the difference?
Start with one distinction: smaller ETF withdrawals are not the same as a return to net buying. The first happened this period; the second did not. ETH and HYPE also remained weaker than BTC, so reclaiming a round number has not brought a recovery across every holding.
ETF withdrawals halved. Has demand actually returned?
| US spot ETFs | 5–9 October | 12–16 October | Positive sessions this period |
|---|---|---|---|
| BTC | −$678.9M | −$228.4M | 2 / 5 |
| ETH | −$542.2M | −$320.1M | 1 / 5 |
| Combined | −$1,221.1M | −$548.5M | — |
Adding Farside’s daily BTC and ETH totals gives a 55.1% reduction in net outflows. The improvement is specific to US spot ETFs: net withdrawals slowed, but another $548.5M still left the funds. Flows have yet to turn positive.
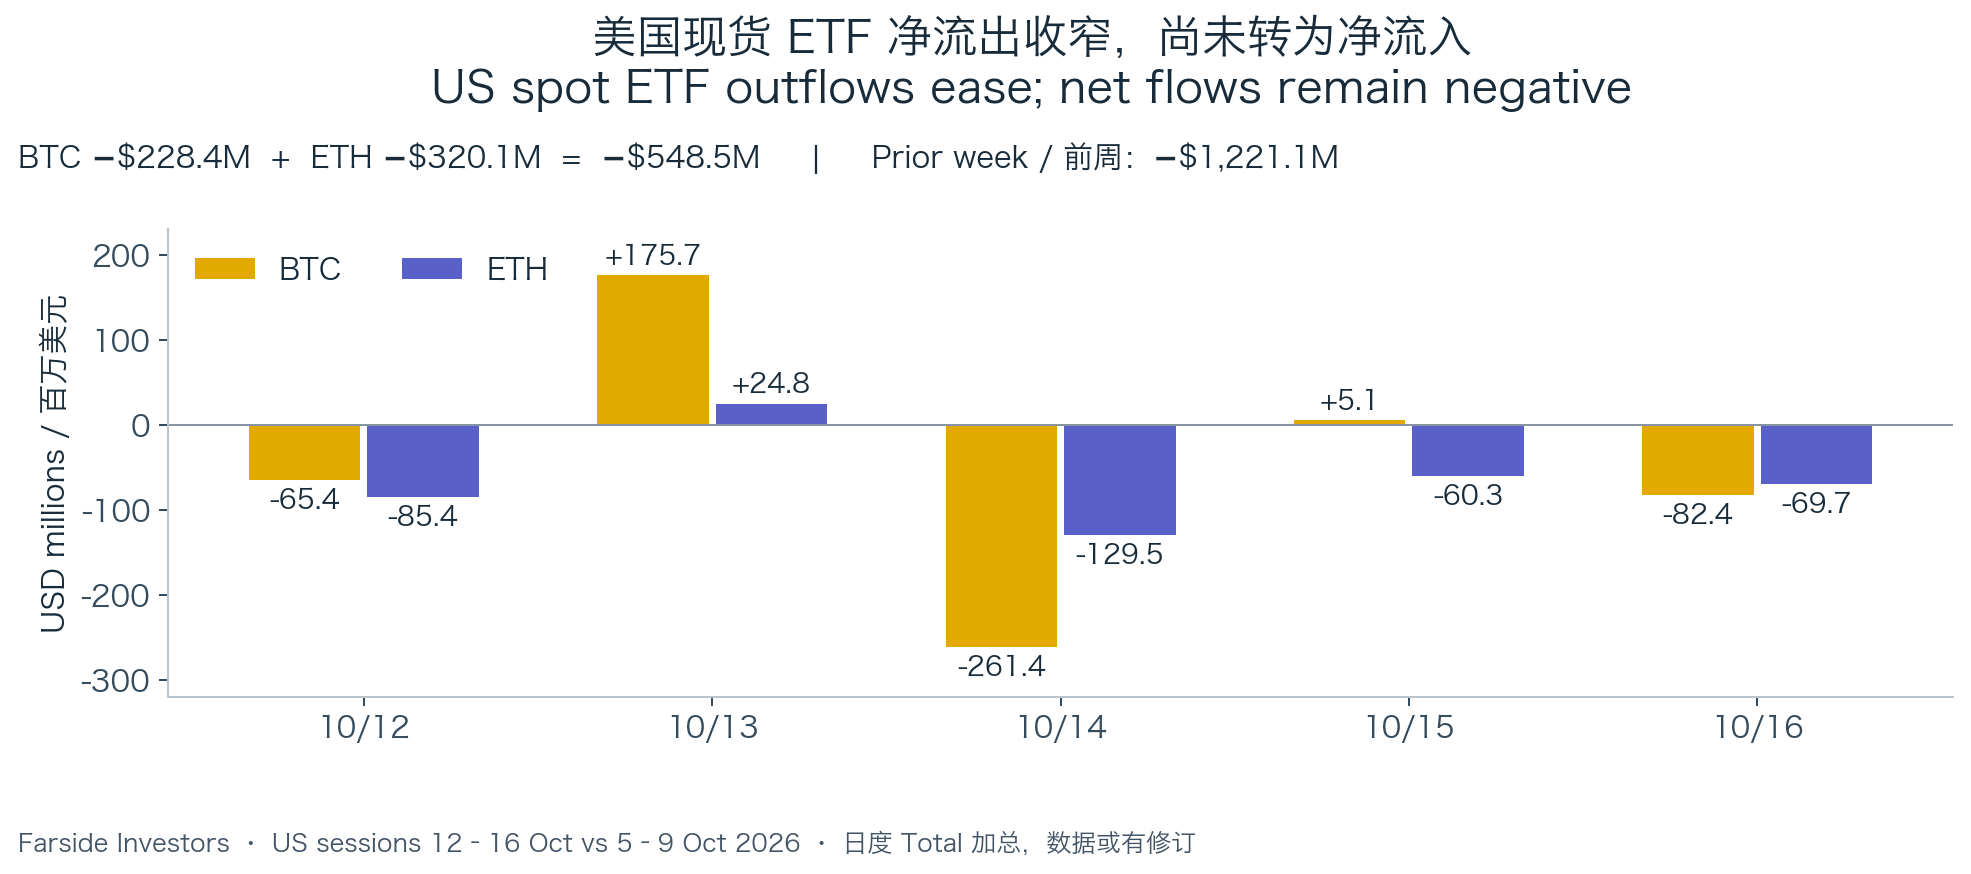 Figure 1. US spot ETF flows in USD millions. Source: Farside Investors, retrieved 18 October. Figures may be revised.
ETH had only one positive session and larger net withdrawals than BTC. That distinction matters more to an ETH holder than the combined improvement alone. ETFs cover only part of demand; buyers elsewhere may be absorbing supply, but this table cannot establish a market-wide return of capital.
Did ETH and HYPE follow Bitcoin’s recovery?
| Hyperliquid market | Six-day return | Period-end price | Period low–high | Base volume vs prior comparable window |
|---|---|---|---|---|
| BTC | −2.72% | $81,451 | $79,732–$84,315 | +22.8% |
| ETH | −5.29% | $2,401.7 | $2,314.4–$2,578.1 | +11.4% |
| HYPE | −10.05% | $77.937 | $77.071–$88.056 | −3.5% |
Returns start at Monday’s open. Volume is each asset’s base-unit volume on Hyperliquid, compared with the same asset over the previous Monday–Saturday window.
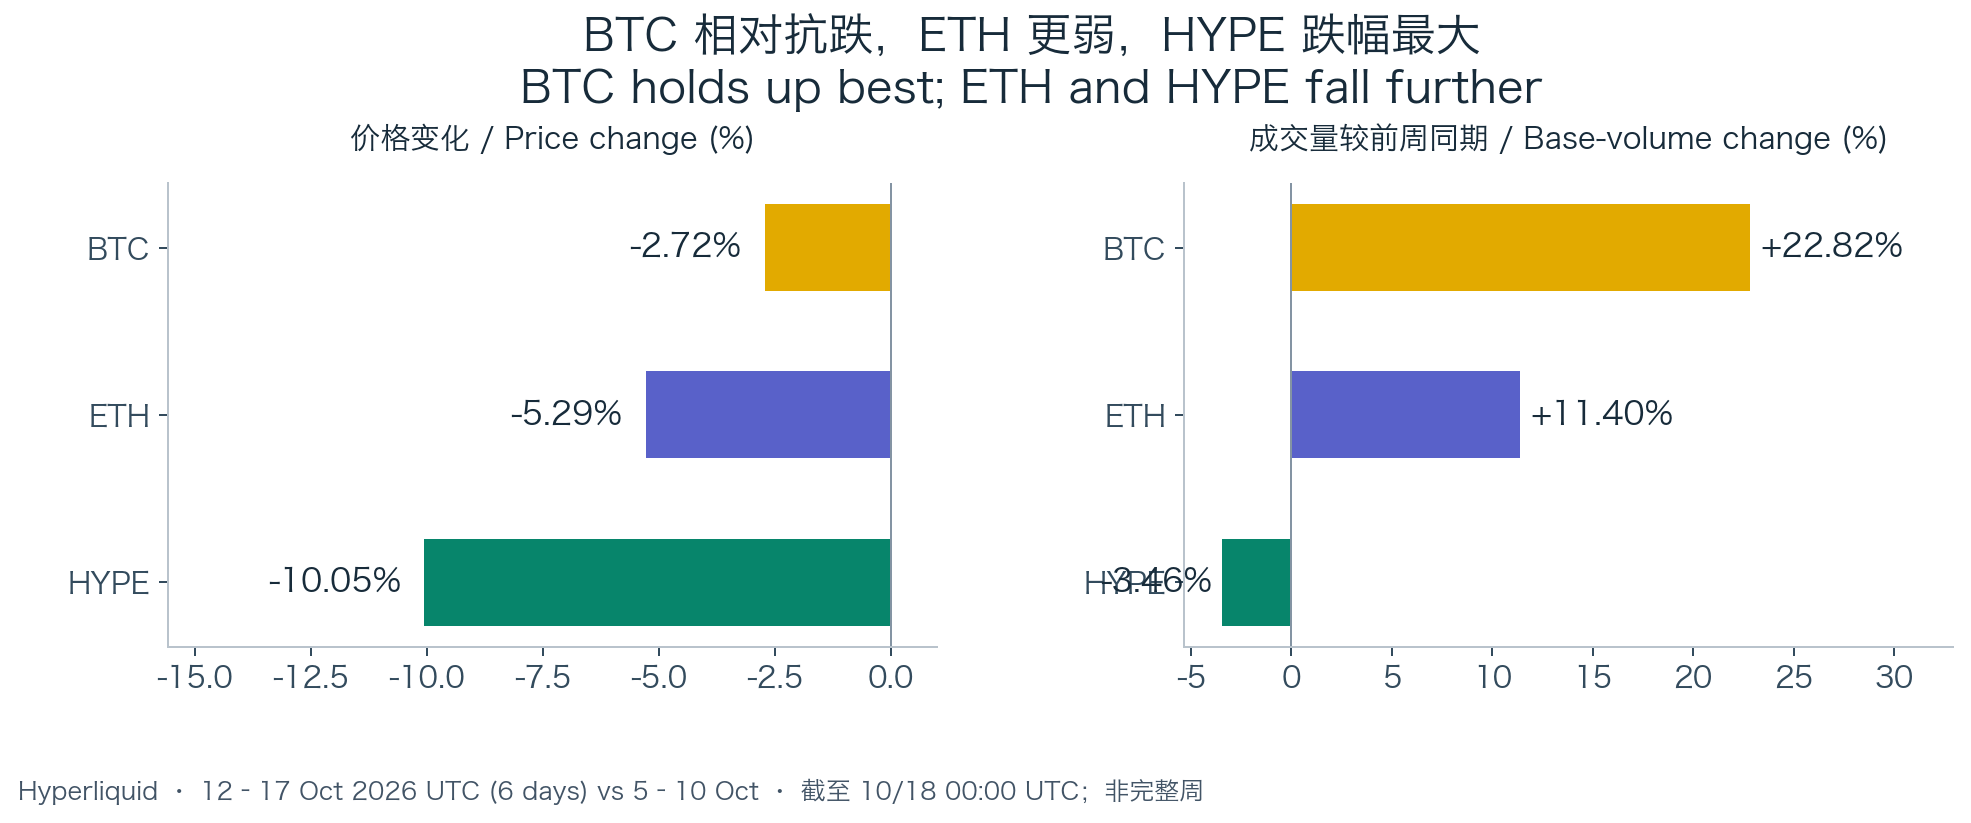 Figure 2. Price window: 12–17 October. Volume comparison: 5–10 October. Both contain six complete UTC days. Source: Hyperliquid daily candles.
BTC held up best; ETH fell further; HYPE had the largest decline. BTC ended near $81,000, still below its $83,730 Monday open, while ETH lost almost twice as much in percentage terms. Watching BTC alone can overstate the recovery in an ETH or HYPE position.
Volume did not provide a consistent upward signal either. On Hyperliquid, BTC and ETH saw more trading than in the prior comparable window while their six-day prices fell; HYPE lost roughly 10% on slightly lower volume. One venue’s turnover cannot identify global spot buying, but these differences make it worth assessing each holding separately.
What did waiting for a rebound cost longs?
| Hyperliquid market | Prior 144-hour funding sum | Current 144-hour funding sum | Positive hours this period |
|---|---|---|---|
| BTC | +0.13567% | +0.14151% | 138 / 144 |
| ETH | +0.12945% | +0.09280% | 123 / 144 |
| HYPE | +0.13114% | +0.15321% | 136 / 144 |
These are simple sums of 144 hourly rates. A positive sum means longs paid shorts on a constant-notional basis. It measures a holding cost, not the number of longs or total market leverage.
HYPE funding rose from 0.13114% to 0.15321%. For an illustrative fixed $10,000 notional position, the six-day bill increased from about $13.11 to $15.32: an extra $2.21. Actual charges vary with position value and holding times.
The scale matters. HYPE’s roughly 10% price decline was the larger pressure on the position. Funding adds a cost to waiting, but the extra charge was small relative to the price move. Positive funding alone also cannot establish that longs are severely overcrowded.
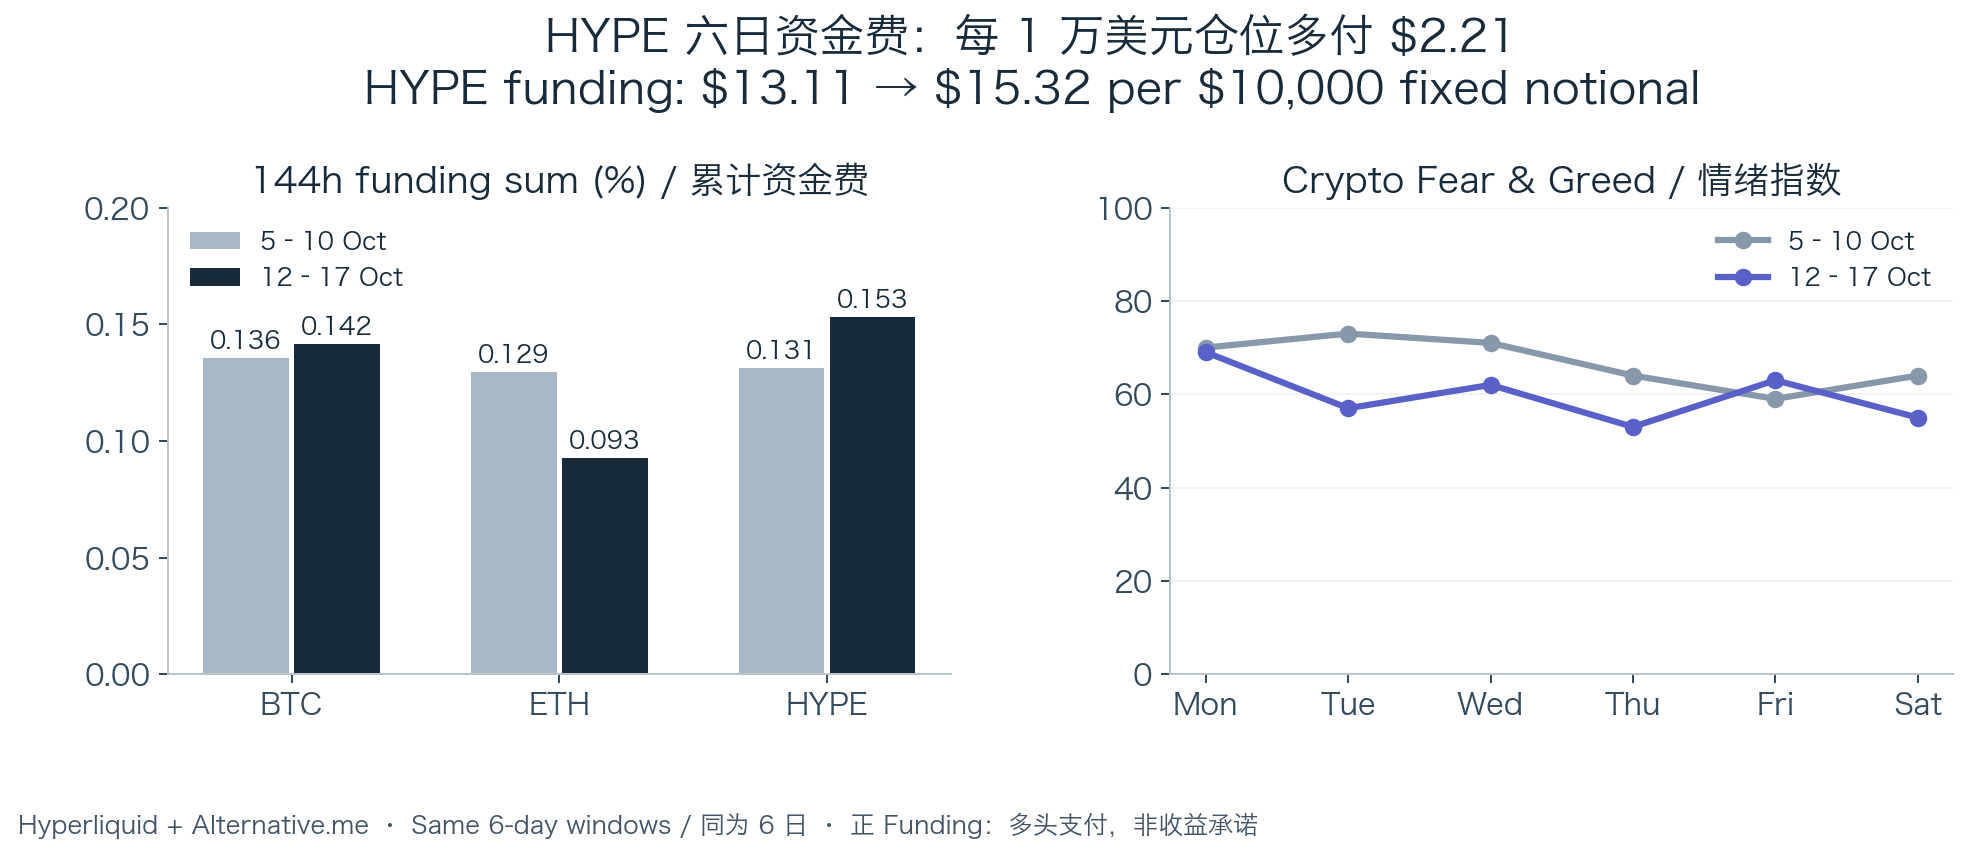 Figure 3. Funding: Hyperliquid. Sentiment: Alternative.me. Funding figures are six-day sums, not annualized yields.
ETH’s lower funding bill means the holding cost declined over this window. For leveraged positions, margin and distance to liquidation deserve attention before that fee: price volatility determines whether the position can survive until a hoped-for recovery.
The cross-exchange funding-cost tool helps compare settlement exposure; Hyperliquid Funding shows current rates.
Do macro conditions and sentiment support the rebound?
September US CPI rose 3.7% year over year and 0.6% month over month; PPI rose 6.3% and 1.3%, with energy an important contributor. Meanwhile, Alternative.me’s six-day sentiment average fell from 66.8 to 59.8, ending at 55. The backdrop remains cautious: inflation complicates expectations of easier policy, and sentiment has not strengthened alongside the bounce. These observations add context rather than explain every price move. BLS CPI · BLS PPI · Sentiment data
What should you watch next?
First, watch how much lost ground prices recover. BTC’s $83,730 Monday open and $84,315 period high, alongside ETH’s $2,578.1 high, provide reference points for the recovery. BTC’s $79,732 and ETH’s $2,314.4 period lows provide the other side: completed daily closes below them would warrant reassessing the bounce. These historical prices are review references, not validated trading signals.
Then, watch whether the ETF improvement persists. Do combined BTC and ETH ETF flows turn positive over the next five US sessions? Sustained price recovery alongside net inflows would strengthen the case for the rebound. Falling prices and renewed withdrawals would weaken it. This period’s $548.5M net withdrawal is a comparison point, not an automatic trade threshold. Non-ETF buyers may still absorb supply during ETF outflows, so prices and ETF flows can temporarily diverge.
Finally, check the asset you actually hold. HYPE remains below its $86.648 Monday open. Watch whether its price recovery lasts, then compare funding over equal holding periods. Lower fees reduce the cost of waiting but cannot substitute for price recovery; leveraged positions also need a separate check of margin and liquidation distance.
Use the BTC market dashboard to follow prices and the sentiment dashboard for context. Subsequent observations appear in Market Depth Weekly.
Data as of 18 October 2026 at 09:00 Tokyo time (JST, UTC+9). Crypto data covers 12–17 October against 5–10 October: six complete UTC days per window. Price, volume and funding come from Hyperliquid and do not cover all global trading or account-level positioning. ETF flows compare the US trading sessions of 12–16 October with 5–9 October. Sunday’s full crypto session is excluded; this remains an in-progress observation.